Return to main page
Volume F Chapter 1
Additional Material
Construction of pictorial graph from links
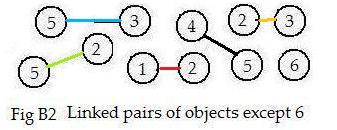
 5-3, 5-2, 1-2, 4-5, 2-3, 6-0
Two linked pairs with a common object in them (as indicated by the same integer-name) may be adjoined at a common object by "attaching two links to the common object along with the other objects in the linked pairs. Object 2 is in the pairs
2-3, 5-2
Adjoin the two pairs at object 2 to obtain 3-2-5. Adjoined linked pairs are better represented in a two dimensional drawing than in a one dimensional line in a discussion. In Fig B2 linked pairs 2-3 and 2-5 adjoined at object 2. Intuitively speaking, snap 3-2 and 2-5 together at 2.
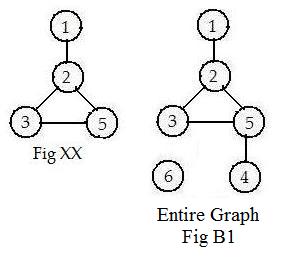
A collection of linked pairs of objects such as in Fig B1 or list (*) provides the building blocks of a completed pictorial graph (Fig B1). Such a picture will give information more quickly to the human eye than a collection of linked objects. A fundamental property of a pictorial graph is that each represented object (more exactly its integer-name) appears once and only once in the picture, because of the nature of adjoining. This is done by a construction that adjoins all linked pairs. Obviously, isolated objects are not involved in the process of adjoining pairs. The following is the construction of the entire pictorial graph from the linked objects given in Fig B1.
Start with the object 1. Put it at the top of the figure. Among all of the linked objects in Fig B1 there is only one linked pair with object 1 in them. Place the link [1-2] vertically.
But in Fig B1, object 2 is linked with three other objects, namely 1, 3, 5. Ignore 1 because of restriction [1.2b]. Therefore, adjoin links 2-3 and 2-5 to object 2.

Object 3 is linked to objects 2 and 5. Ignore object 2 ([1.2b]) and adjoin link 3-5. See Fig XX.
Object 4 appears only once and is linked to object 5. Adjoin 5-4 to object 5.
Object 5 is linked to objects 2,3,4, but links involving these objects and object 5 cannot be adjoined to 5 because of [1.2b]. It is impossible to adjoin more links.
All five links and all six objects have been included in the completed graph in Fig B1.
The construction stops.

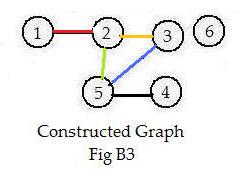
The linked pairs in Fig B1 can be adjoined but positioned differently to produce the graph in Fig B3. All of the linked pairs in Fig B2 appear in graphs in Fig B1 and in Fig B3. The graphs are equivalent even though they have a different appearance. They are equivalent in structure because the same object in either picture has the same neighbors.
The adjoining of the linked pairs of objects in Fig B2 to make a pictorial graph in Fig B1 produces a figure that is very useful for human understanding. For example, it is very easy to find all the objects linked to object 2. They are 1,3,5. These three objects are called neighbors of object 2. Object 4 has only one neighbor, object 5. Object 6 has no neighbors, another way to define isolated objects.
WARNING: This method is not always practical to perform, especially if the links are many.
Creating short graph array from drawing of graph
In this discussion integers are either in red or in black. When presented as input or a storage the red integers become negative. The black integers remain natural numbers. Any black zeros disappear.
 If there are n individual objects in the graph, they have received red intividual integer-names, 1,2,...,n in this discussion. However their neighbors receive black natural numbers. For each of these objects, find all of its neighbors. Select and record all of those integer-names of neighbors larger than the integer-name of the object. For the graph in the adjacent figure, the following array is formed:
1,2,3, 2,4,5,6, 3,7, 4, 5, 6,7, 7, 8,0, 9,0
Objects 4,5,6 have neighbor 2, but 2 is less than 4,5,6 and is omitted.
But object 6 has neighbor 7. SInce 7 is larger than 6 7 is listed after the 6. Object 7 has no neighbor listed after it because both 3 and 6 are less than 7.
A colorful form of the short graph array is
1,2,3, 2,4,5,6, 3,7, 6,7, 8, 9
Since the computer is color-blind, convert all red integers to negative integers. Then the short graph array ready for input is:
(-1,2,3, -2,4,5,6, -3,7, -6,7, -8, -9)
The parentheses () tell the computer that the data for input is in the form of a graph array.
The following are the general instructions for deriving the simple graph array form from a drawing:
(a) For each object locate all of its neighbors.
(b) Delete all neighbors whose integer names are less than the integer-name of the object.
(c) Write the negative of the integer-name of the object and after it write all the undeleted integer-names (natural numbers) of the neighbors.
Note1: if all the integer-names (natural numbeers) of the neighbors have been deleted, do not write the (negative of the) integer-name of the object in the array.
Note2: if the object is isolated, then write only the negative of its integer-name, with no natural numbers immediately after it.
(d) Enclose the entire short graph array in parentheses.
Derivation of short graph array from linked pairs
 The input collection of linked pairs of a graph was given as
(*) [5-3, 5-2, 1-2, 4-5, 2-3, 6-0]
In processing this collection, not only does the computer strip the brackets from the data, but it reverses and rearranges some of the linked pairs. The data becomes
(**) 1-2, 2-3, 2-5, 3-5, 4-5, 6-0
The linked pairs in (**) and in (*) give the same information about the graph because the links are bidirectional. Moreover, the linked pairs in (**) are super-sorted. Not only are the left integer-names in order:
(***) 1-2, 2-3, 2-5, 3-5, 4-5, 6-0
but when those left integers equal, then the right integer-names are in increasing order.
2-3, 2-5
Replace dashes (-) with commas (,) in (***) and combine the black numbers after the same red number to get
1,2, 2,3,5, 3,5, 4,5, 6,0
Replace all red numbers with negative black numbers and delete any zeros:
(-1,2, -2,3,5, -3,5, -4,5, -6).
This is the short graph array for graph B1 above.


 5-3, 5-2, 1-2, 4-5, 2-3, 6-0
 If there are n individual objects in the graph, they have received red intividual integer-names, 1,2,...,n in this discussion. However their neighbors receive black natural numbers. For each of these objects, find all of its neighbors. Select and record all of those integer-names of neighbors larger than the integer-name of the object. For the graph in the adjacent figure, the following array is formed: